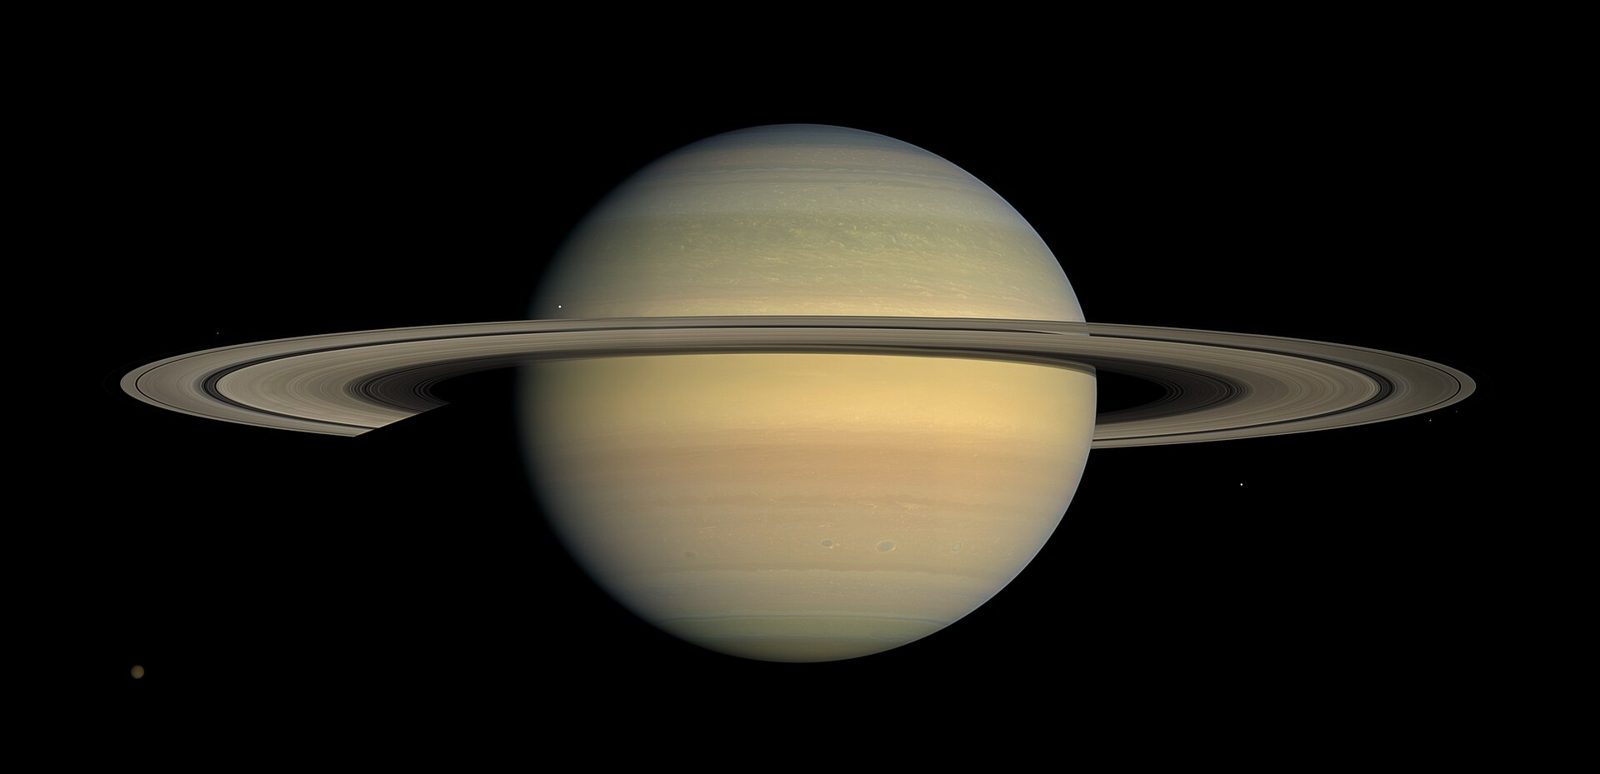
The Most Useful Space Image Is a Graph
The prettiest image from a telescope is often the least revealing. A spectrum—a graph of light split by wavelength—is how astronomers learn what a faraway world is actually made of.
6 posts.
The prettiest image from a telescope is often the least revealing. A spectrum—a graph of light split by wavelength—is how astronomers learn what a faraway world is actually made of.
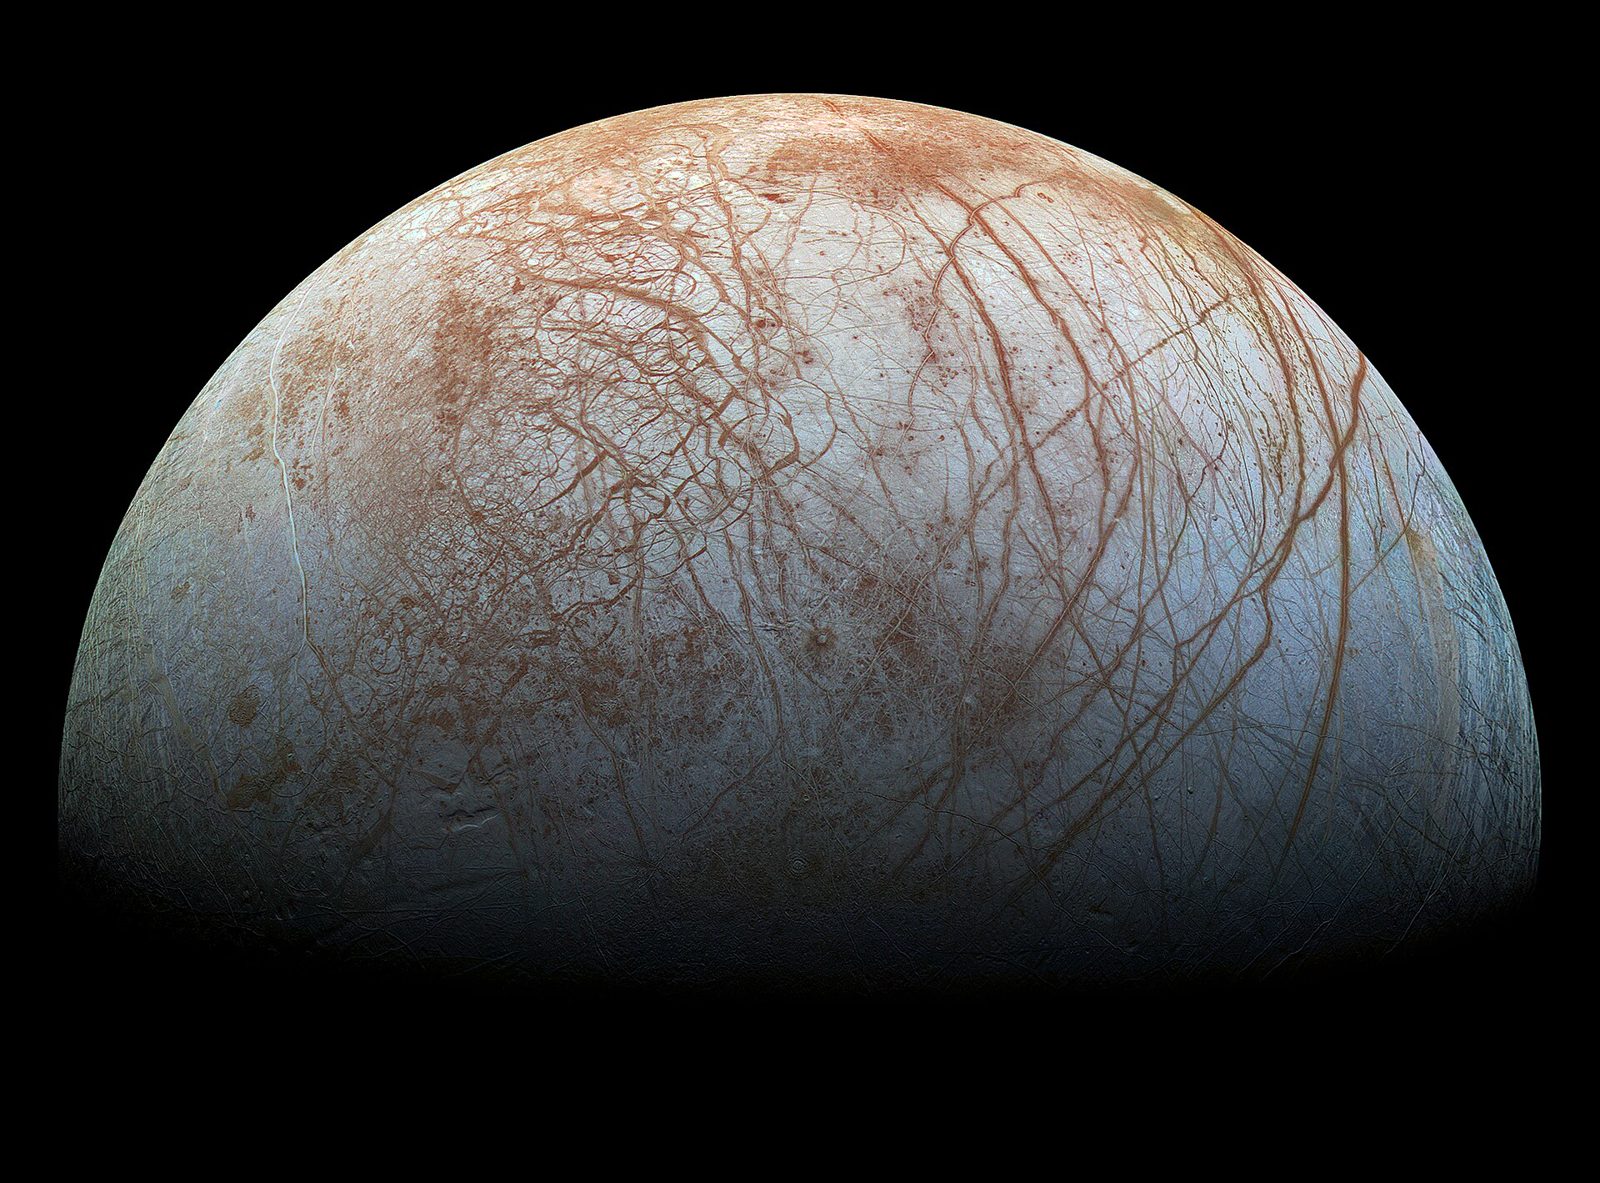
Beneath Europa's fractured ice sits an ocean with twice the water of Earth's seas, kept liquid for billions of years by tidal kneading. The Europa Clipper is on its way to taste it.
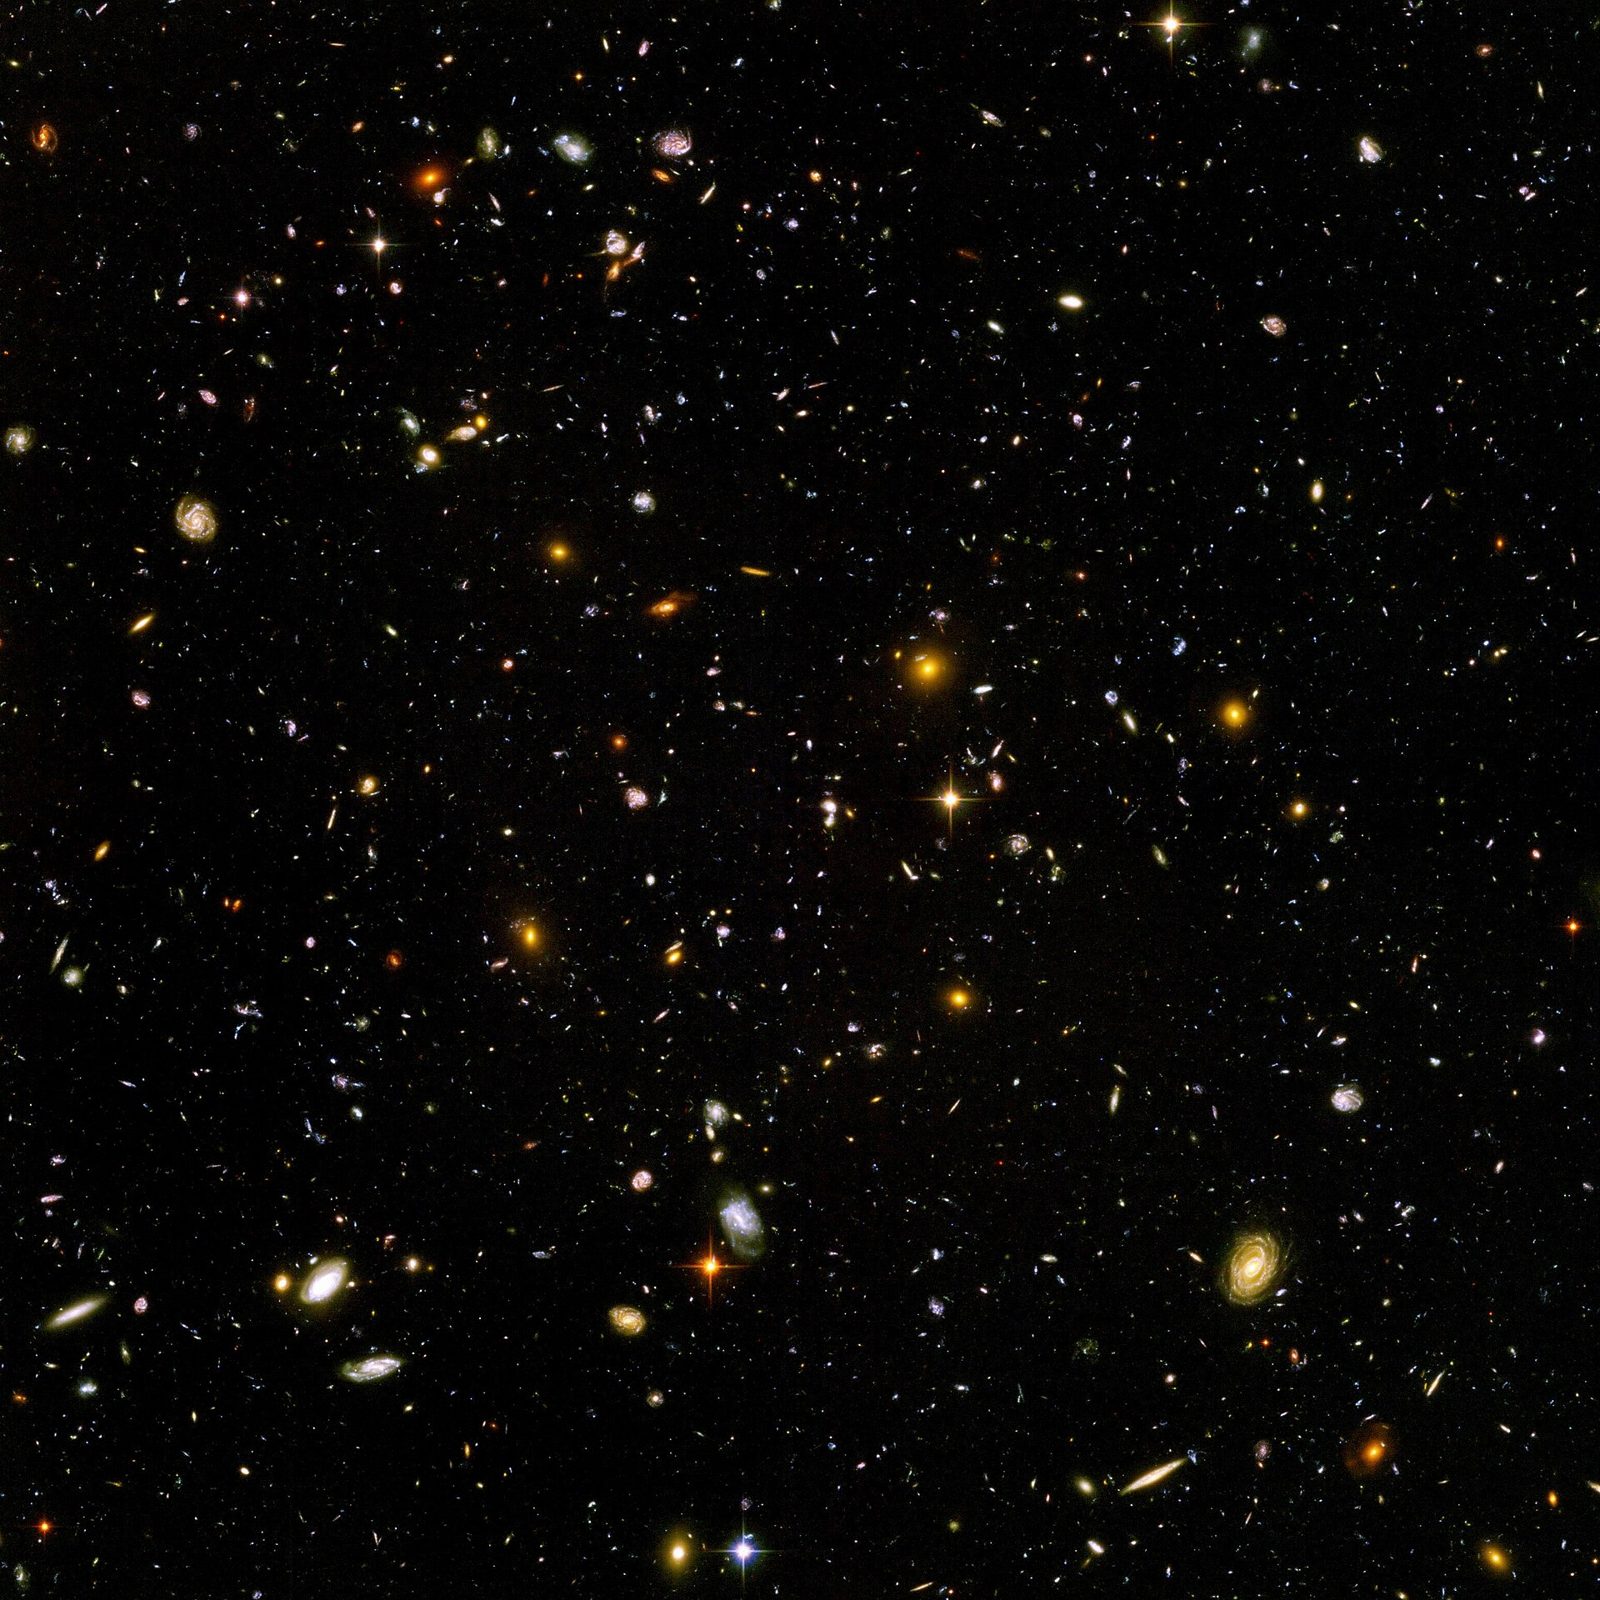
Tides drop to 40 percent. The axial tilt wobbles between 0 and 85 degrees over millions of years. Nights go pitch black. The moon is not just a pretty rock it is the reason Earth's climate is stable enough for civilization.
JWST found methane and carbon dioxide in a hycean world's atmosphere, then a team claimed dimethyl sulfide at 3-sigma. Within a week, another team refit the same data and found nothing. The story of how a biosignature claim lives and dies.

GWTC-3 added 35 new mergers to bring the total to 90, found the best neutron-star-black-hole candidates yet, and left general relativity still standing. The population statistics are where the real story is.
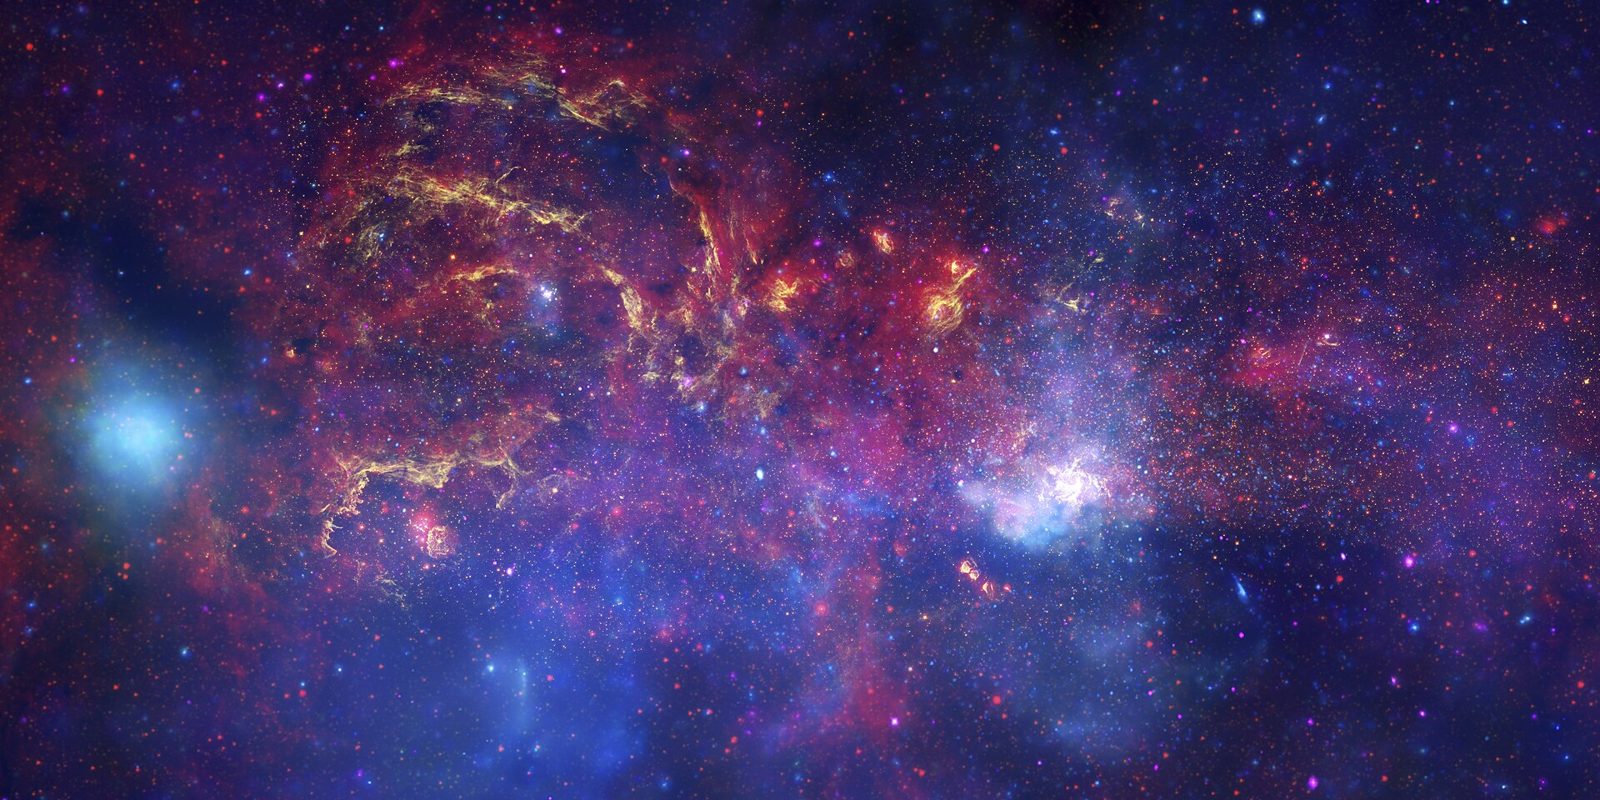
Gaia has found 100+ stellar streams crisscrossing the Milky Way halo. Each gap, spur, and kink is a dark-matter subhalo's fingerprint. Here's how astronomers read them.