The Dark Energy Survey Just Mapped the Cosmic Web — Here's What the Largest Structure in the Universe Actually Looks Like
On this page · 7 sections
- Also see: How sleep clears the brain
- Also see: Nemotron 3 Ultra for agentic work
- Also see: The cosmic web, mapped
flowchart TD
    A["Light from distant galaxies"] --> B["Travels through cosmic web"]
    B --> C["Dark matter bends spacetime"]
    C --> D["Galaxy shapes slightly distorted"]
    D --> E["Weak lensing shear measured"]
    E --> F["Reconstruct dark matter map"]
    F --> G["Compare to Lambda-CDM predictions"]
    G --> H{"Match?"}
    H -->|"Yes"| I["Standard model holds"]
    H -->|"No"| J["New physics needed"]

    style A fill:#e8f4fd,stroke:#333
    style G fill:#fff3cd,stroke:#333
    style J fill:#f8d7da,stroke:#333
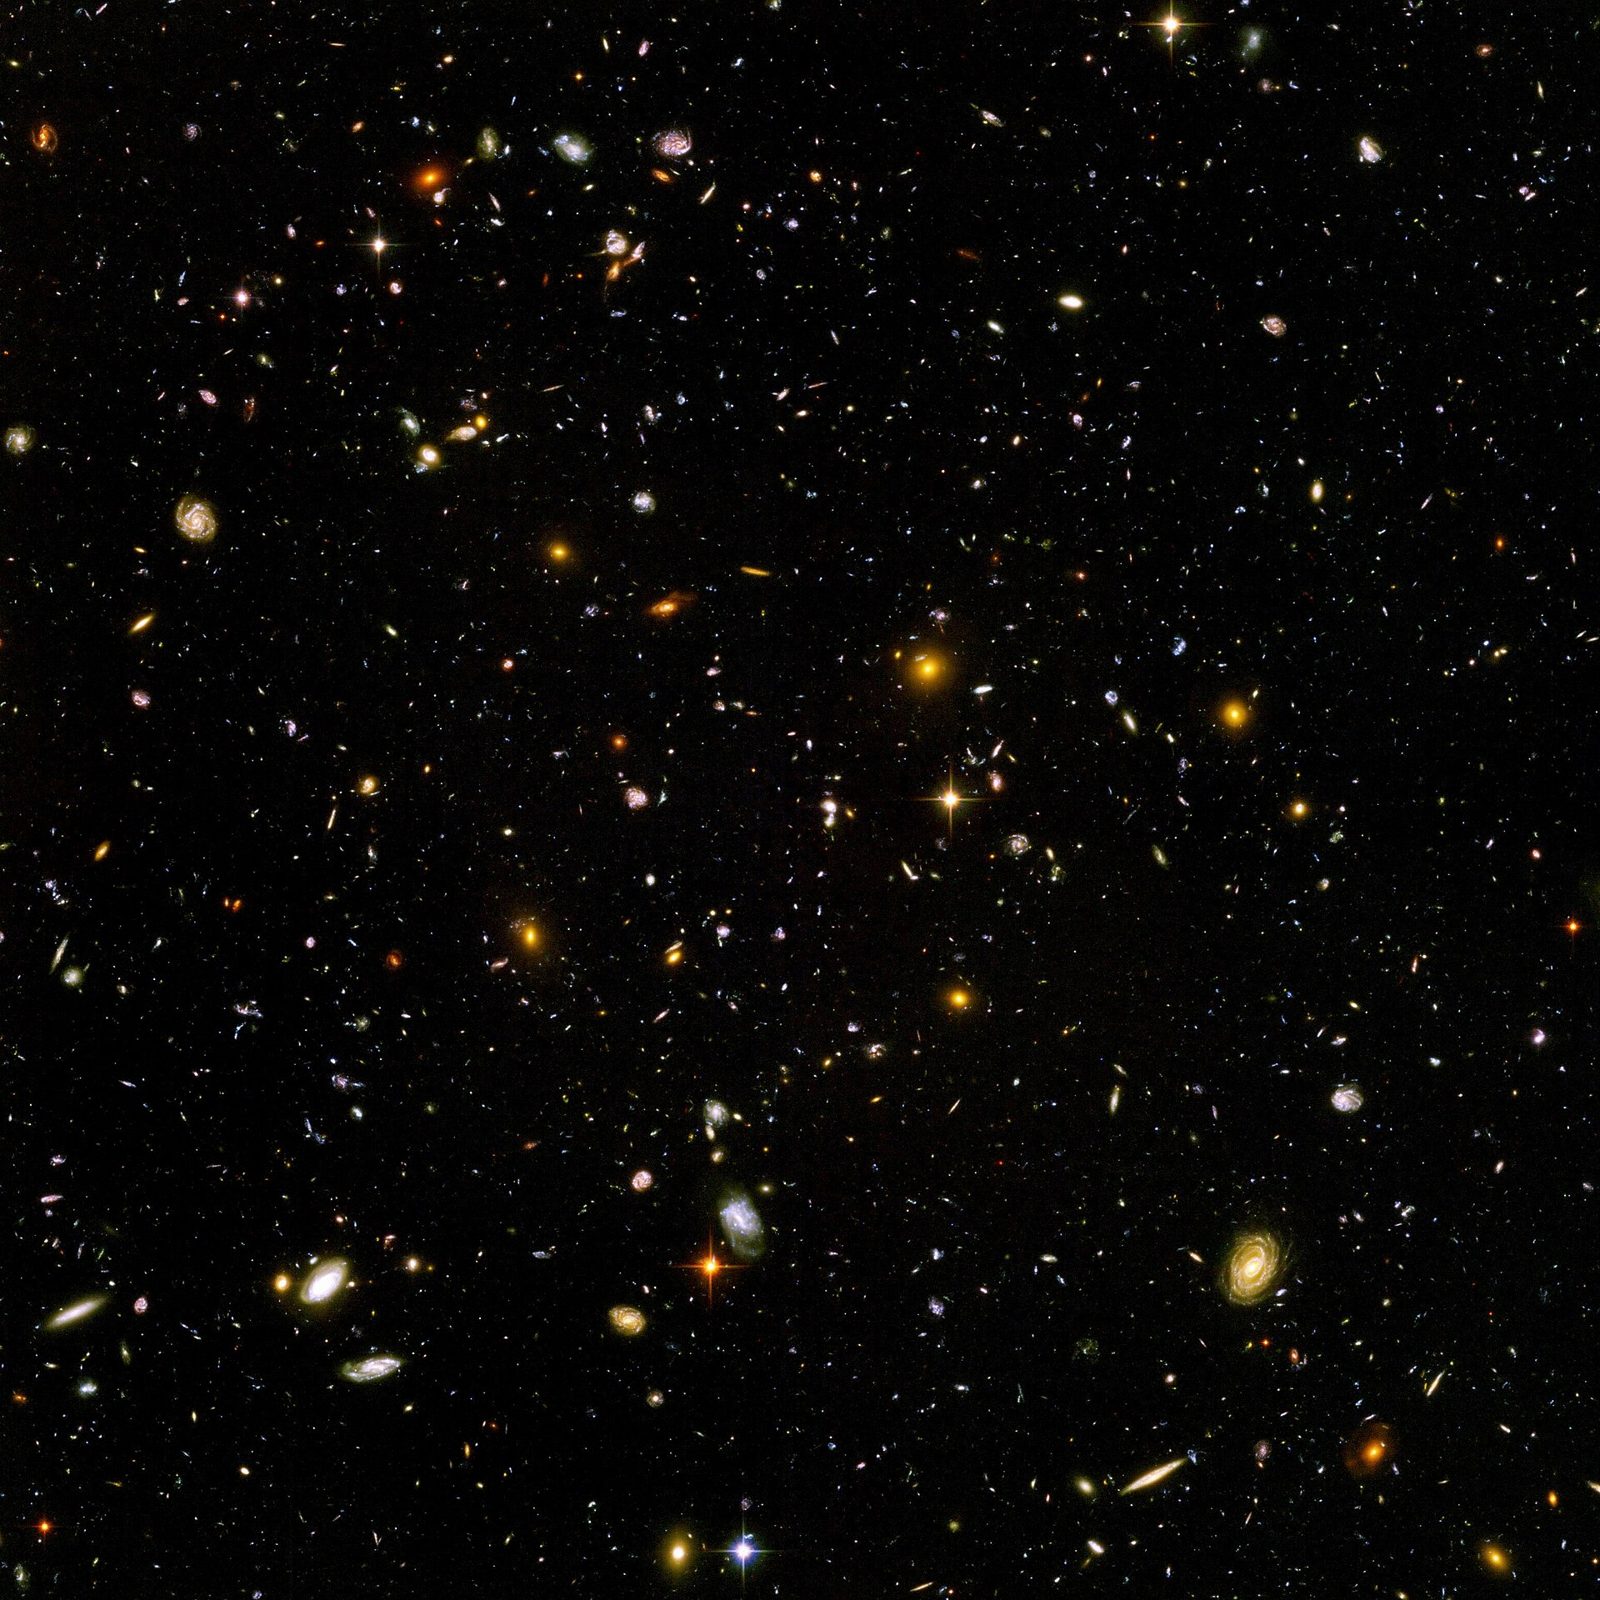
The largest structure in the universe is not a galaxy, not a cluster, not even a supercluster. It is the cosmic web — a vast, filamentary network of dark matter and gas that stretches across billions of light-years, with galaxies strung along its threads like dew on a spider’s silk.
On October 7, 2026, the Dark Energy Survey (DES) collaboration released its final cosmological results: the most precise map of this cosmic web ever constructed. Six years of observations. 5,000 square degrees of southern sky — one-eighth of the entire celestial sphere. Nearly 300 million galaxies measured. And a result that both confirms our standard model of cosmology and quietly deepens one of its most stubborn tensions.
How You Weigh the Invisible
Dark matter does not emit, absorb, or reflect light. It is, by definition, dark. But it has mass, and mass bends spacetime. When light from a distant galaxy travels through the cosmic web toward our telescopes, the gravitational fields of intervening dark matter filaments and halos deflect its path ever so slightly. The galaxy’s apparent shape is distorted — stretched tangentially around the mass concentration, compressed radially.
This is weak gravitational lensing. The effect is tiny: typical distortions are of order 1–2%, far smaller than the intrinsic ellipticity of galaxies themselves. But if you measure the shapes of millions of galaxies and average them, the random orientations cancel out, and the coherent lensing signal emerges.
DES used the 570-megapixel Dark Energy Camera (DECam) on the 4-meter Blanco Telescope at Cerro Tololo in Chile. Over 758 nights between 2013 and 2019, it imaged the same patches of sky repeatedly in five optical bands (g, r, i, z, Y), building up depth and controlling systematics. The final catalog contains photometry and shape measurements for 226 million galaxies in the “gold” sample, with a median redshift of z ≈ 0.7 — meaning we see them as they were about 6.5 billion years ago.
graph LR
    subgraph DECam["Dark Energy Camera (DECam)"]
        D1["570 megapixels"]
        D2["2.2° field of view"]
        D3["5 optical bands: g,r,i,z,Y"]
        D4["0.27 arcsec/pixel"]
    end

    subgraph Survey["DES Survey Strategy"]
        S1["5,000 sq deg footprint"]
        S2["758 nights over 6 years"]
        S3["10 exposures per field"]
        S4["~24th mag depth"]
    end

    subgraph Output["Final Cosmology Sample"]
        O1["226M galaxies gold sample"]
        O2["Median z ≈ 0.7"]
        O3["300M total with photo-z"]
        O4["Shear catalog: metacalibration"]
    end

    DECam --> Survey
    Survey --> Output
The shape measurement pipeline uses metacalibration — a technique that applies artificial shears to the images themselves to calibrate the response of the shape estimator to real shear, bypassing the need for perfect simulations of the point-spread function. It is, in effect, the camera calibrating itself.
The Cosmic Web Revealed
The result is a map of projected dark matter density across 5,000 square degrees. Filaments stretch across degrees of sky. Voids — vast underdense regions tens of millions of light-years across — appear as dark basins. Massive clusters show up as bright peaks. It is the universe’s skeleton, rendered visible through the distortion of background light.
The map agrees remarkably well with the predictions of Lambda-CDM — the standard model of cosmology, with cold dark matter and a cosmological constant (Lambda) driving accelerated expansion. The power spectrum of matter fluctuations, the two-point correlation function, the cluster abundance — all match the model that has been refined over three decades.
But there is a but.
The S8 Tension
The key parameter is S8 — a combination of the matter density (Ωm) and the amplitude of matter fluctuations (σ8), defined as S8 = σ8(Ωm/0.3)^0.5. It quantifies how “clumpy” the universe is on scales of about 8 megaparsecs.
- Planck CMB (2018): S8 = 0.832 ± 0.013 — inferred from the primordial fluctuations imprinted on the cosmic microwave background, extrapolated forward using Lambda-CDM.
- DES Year 3 (2024): S8 = 0.776 ± 0.017 — measured directly from the late-time universe via weak lensing and galaxy clustering.
- DES Final (2026): S8 = 0.776 ± 0.014 — the uncertainty shrank, but the central value did not move.
xychart-beta
    title "The S8 Tension: Early vs Late Universe"
    x-axis ["Planck CMB 2018", "DES Y3 2024", "DES Final 2026", "KiDS-1000", "HSC Y3"]
    y-axis "S8" 0.74 --> 0.86
    bar [0.832, 0.776, 0.776, 0.766, 0.773]
    line [0.832, 0.832, 0.832, 0.832, 0.832]
The discrepancy is 2.3–2.5 sigma — not yet the 5-sigma threshold for a discovery, but persistent across multiple independent weak-lensing surveys (KiDS, HSC, DES). The late universe is consistently less clumpy than the early universe predicts.
If real, this could mean:
- Dark energy is not a cosmological constant — perhaps it evolves (w ≠ -1), changing the growth of structure.
- Neutrino masses are larger than the minimal sum (∑mν > 0.06 eV), suppressing small-scale clustering.
- Modified gravity — general relativity may need correction on cosmic scales.
- Systematics — something in the CMB analysis, the lensing measurements, or both, is not fully understood.
What the Final DES Analysis Adds
The 2026 final release improves on the Year 3 (Y3) analysis in several ways:
| Improvement | Y3 (2024) | Final (2026) |
|---|---|---|
| Sky area | 4,143 sq deg | 5,000 sq deg |
| Gold galaxies | 100M | 226M |
| Photo-z calibration | 4 bands | 5 bands + spectroscopic training |
| Shear calibration | Metacalibration v1 | Metacalibration v2 + image simulations |
| Baryonic modeling | Fixed | Marginalized over 7 parameters |
| Intrinsic alignments | NLA model | TATT model + marginalization |
| S8 uncertainty | ±0.017 | ±0.014 |
The most important advance is the treatment of baryonic physics — the messy, non-gravitational processes (gas cooling, star formation, AGN feedback) that reshape dark matter halos on small scales. Previous analyses either cut small scales or fixed a baryonic model. The final DES analysis marginalizes over a flexible 7-parameter baryonic model, letting the data decide how much small-scale power is suppressed by gas physics. The result: the S8 tension persists even when baryons are fully marginalized.
The Cosmic Web in 3D: Tomography
DES doesn’t just make a 2D map. By dividing galaxies into redshift bins (10 bins from z=0.2 to z=1.3), it constructs a tomographic view — the cosmic web at different cosmic epochs. This is powerful because the growth of structure is time-dependent: dark energy suppresses growth at late times, so the clumpiness at z=0.3 should differ from z=1.0 in a predictable way.
flowchart TD
    subgraph Z1["z = 0.2–0.4 (Nearby)"]
        A1["Dense filaments"]
        A2["Massive clusters"]
        A3["Voids well-defined"]
    end

    subgraph Z2["z = 0.6–0.8 (Mid-range)"]
        B1["Filaments forming"]
        B2["Proto-clusters"]
        B3["Web assembling"]
    end

    subgraph Z3["z = 1.0–1.3 (Distant)"]
        C1["Primordial fluctuations"]
        C2["Linear regime"]
        C3["Less non-linear growth"]
    end

    Z3 --> Z2 --> Z1
The tomographic analysis confirms that the growth rate of structure matches Lambda-CDM predictions — except for the overall amplitude. The shape of the growth function is right; the normalization is low.
What Comes Next
DES is done. But the cosmic web is just beginning to be mapped at this precision.
- Rubin Observatory (LSST): Starting 2025, 18,000 sq deg, billions of galaxies, 10x the statistical power of DES.
- Euclid: ESA’s space mission, 15,000 sq deg, optical + near-IR, no atmospheric seeing.
- Roman Space Telescope: NASA’s wide-field infrared survey, 2,000 sq deg but unprecedented depth and resolution.
- DESI: Already taking spectra of 30 million galaxies and quasars, measuring baryon acoustic oscillations and redshift-space distortions — a completely independent probe of structure growth.
graph LR
    DES["DES Final\n5,000 sq deg\n226M galaxies\nS8 = 0.776±0.014"] --> Rubin["Rubin LSST\n18,000 sq deg\n~10B galaxies\nσ(S8) ~ 0.005"]
    DES --> Euclid["Euclid\n15,000 sq deg\nSpace-based\nσ(S8) ~ 0.006"]
    DES --> Roman["Roman\n2,000 sq deg\nIR + spectroscopy\nσ(S8) ~ 0.007"]
    DES --> DESI["DESI\n14,000 sq deg\n30M spectra\nBAO + RSD"]

    style Rubin fill:#d4edda,stroke:#333
    style Euclid fill:#d4edda,stroke:#333
    style Roman fill:#d4edda,stroke:#333
    style DESI fill:#d4edda,stroke:#333
By 2030, the S8 tension will either be a >5σ discovery of new physics or a resolved systematic. There is no middle ground.
Why It Matters
The cosmic web is not abstract. It is the framework within which every galaxy formed, every star ignited, every planet assembled. The dark matter filaments channeled gas into the first halos. The voids defined where galaxies could not form. The clusters became the crucibles of metal enrichment. We are, in a literal sense, made of material that flowed along these filaments.
Mapping the cosmic web is mapping our own ancestry — not biological, but physical. The DES final map is the most detailed baby picture of that ancestry we have yet seen.
And it may be telling us that the story we’ve been telling ourselves about the universe — Lambda-CDM, the cosmological constant, the standard model — is missing a chapter.
Further reading from independent authors

Take a break
A mini crossword and a Sudoku, set for this article. They play offline and nothing leaves your browser.
Mini crossword
Across
Down
Sudoku 0:00
Comments
Loading the conversation…